Microsoft - AZ-801: Configuring Windows Server Hybrid Advanced Services
Sample Questions
Question: 329
Measured Skill: Migrate servers and workloads (20-25%)
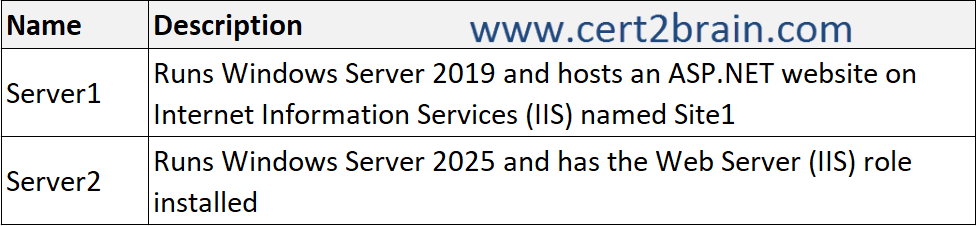
Your network contains an Active Directory Domain Services (AD DS) domain named contoso.com. The domain contains the servers shown in the following table.
You need to migrate Site1 from Server1 to Server2. The solution must meet the following requirements:
- Minimize how long it takes to perform the migration.
- Minimize administrative effort.
Which three actions should you perform in sequence?
(To answer, move the appropriate actions from the list of actions to the answer area and arrange them in the correct order.)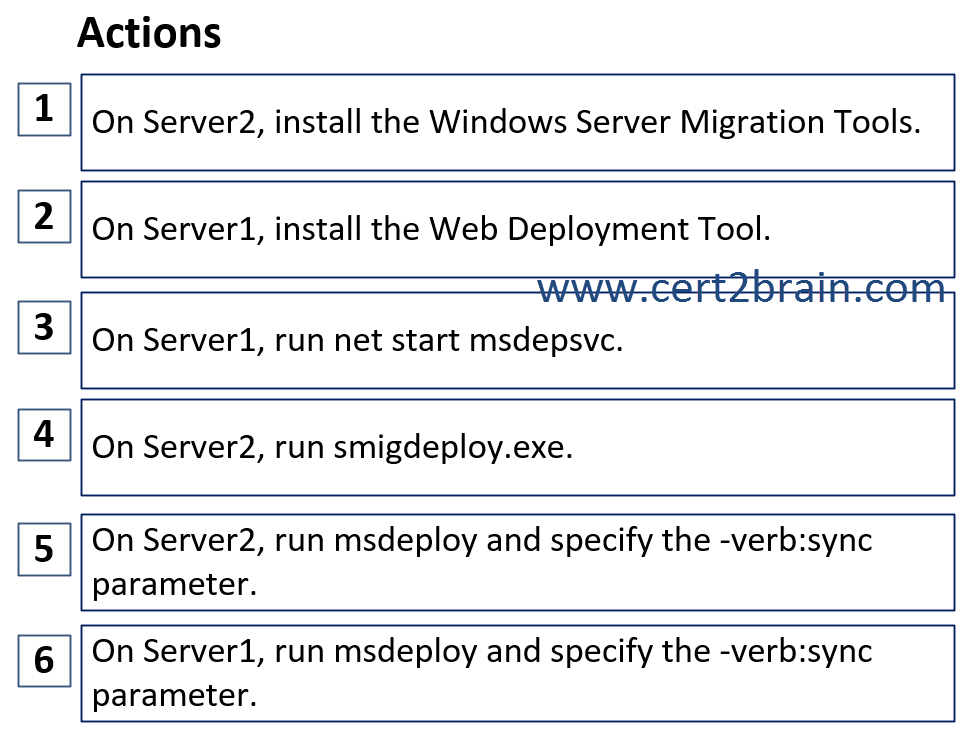
| A | Sequence: 1, 4, 3 |
| B | Sequence: 2, 1, 6 |
| C | Sequence: 2, 3, 4 |
| D | Sequence: 1, 2, 5 |
Correct answer: BExplanation:
First, we need to install the Web Deployment Tool (Web Deploy) on the source server (Server1). Web Deploy ca be used to export web deployment packages from Internet Information Services (IIS) and to pubslish these packages to a remote server. Web Deploy installs the MSDeploy.exe command-line utility.
The net start msdepsvc command starts the Web Deploy service.
The –verb:sync argument of the MSDeploy.exe command-line utility indicates that you want to replicate the source content on the destination server.
References:
Deploying Web Packages
Installing and Configuring Web Deploy on IIS 8.0 or Later
Question: 330
Measured Skill: Secure Windows Server on-premises and hybrid infrastructures (25-30%)
You have an Azure subscription. The subscription contains a virtual machine named VM1 that runs Windows Server and an Azure key vault named Vault1. VM1 has a system-assigned managed identity enabled.
You need to enable Azure Disk Encryption for VM1.
What should you do first?| A | From Vault1, grant VM1 permissions to use keys and secrets. |
| B | Enable confidential OS disk encryption for VM1. |
| C | From VM1, modify the local Group Policy Object (GPO) to allow BitLocker key storage. |
| D | Install a BitLocker recovery certificate on VM1. |
Correct answer: AExplanation:
Azure Disk Encryption helps protect and safeguard your data to meet your organizational security and compliance commitments. ADE encrypts the OS and data disks of Azure virtual machines (VMs) inside your VMs by using the DM-Crypt feature of Linux or the BitLocker feature of Windows. ADE is integrated with Azure Key Vault to help you control and manage the disk encryption keys and secrets, with the option to encrypt with a key encryption key (KEK).
Azure Disk Encryption (ADE) uses Azure Key Vault to store and manage encryption keys and secrets. Before enabling ADE, the VM (via its managed identity) must be authorized to access the Key Vault.
Specifically:
- The managed identity of VM1 needs permissions such as:
- Get / list secrets
- Get / wrap / unwrap keys
- Without these permissions, the encryption process cannot retrieve or store keys.
References:
Overview of managed disk encryption options
Create and configure a key vault for Azure Disk Encryption on a Windows VM
Question: 331
Measured Skill: Implement and manage Windows Server high availability (10-15%)
Your network contains an Active Directory Domain Services (AD DS) domain.
You need to deploy a Storage Spaces Direct cluster. The solution must support dual parity.
What is the minimum and maximum number of nodes you can deploy to the cluster?
(To answer, select the appropriate options in the answer area. NOTE: Each correct selection is worth one point.)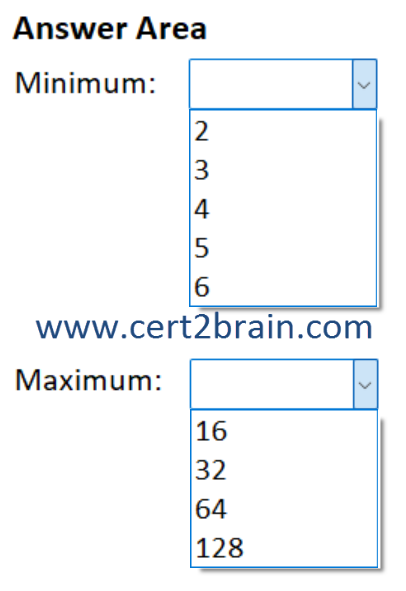
| A | Minimum: 2
Maximum: 32 |
| B | Minimum: 2
Maximum: 128 |
| C | Minimum: 3
Maximum: 64 |
| D | Minimum: 4
Maximum: 16 |
| E | Minimum: 5
Maximum: 16 |
| F | Minimum: 6
Maximum: 64 |
Correct answer: DExplanation:
Storage Spaces Direct provides fault tolerance, often called "resiliency," for your data. Its implementation is similar to RAID, except distributed across servers and implemented in software.
As with RAID, there are a few different ways Storage Spaces can do this, which make different tradeoffs between fault tolerance, storage efficiency, and compute complexity. These broadly fall into two categories: "mirroring" and "parity," the latter sometimes called "erasure coding."
Dual parity
Dual parity implements Reed-Solomon error-correcting codes to keep two bitwise parity symbols, thereby providing the same fault tolerance as three-way mirroring (i.e. up to two failures at once), but with better storage efficiency. It most closely resembles RAID-6. To use dual parity, you need at least four hardware fault domains – with Storage Spaces Direct, that means four servers. At that scale, the storage efficiency is 50% – to store 2 TB of data, you need 4 TB of physical storage capacity.
The storage efficiency of dual parity increases the more hardware fault domains you have, from 50 percent up to 80 percent. For example, at seven (with Storage Spaces Direct, that means seven servers) the efficiency jumps to 66.7 percent – to store 4 TB of data, you need just 6 TB of physical storage capacity.
With fewer than 4 nodes, S2D cannot provide dual parity resilience. 16 nodes is the supported upper limit for an S2D cluster.
Reference: Fault tolerance and storage efficiency on Azure Local and Windows Server clusters
Question: 332
Measured Skill: Secure Windows Server on-premises and hybrid infrastructures (25-30%)
Your network contains an Active Directory Domain Services (AD DS) domain. The domain contains a server named Server1 that runs Windows Server 2025. All domain controllers run Windows Server 2019. The domain contains a user named User1.
You need to ensure that User1 can promote Server1 to a domain controller. The solution must follow the principle of least privilege.
Which groups should User1 be a member of?| A | Domain Admins only |
| B | Enterprise Admins only |
| C | Domain Admins and Schema Admins only |
| D | Domain Admins, Enterprise Admins, and Schema Admins |
Correct answer: DExplanation:
To install the first DC that runs the latest Windows Server version in an existing domain and forest, the machine where you run the installation needs connectivity to:
- The schema master to run adprep /forestprep.
- The infrastructure master to run adprep /domainprep.
To install the first DC in a domain where the forest schema is already extended, you only need connectivity to the infrastructure master.
To install or remove a domain in an existing forest, you need connectivity to the domain naming master.
To run adprep /forestprep, membership in the schema admins, enterprise admins, and domain admins groups is required.
To run adprep /domainprep, membership in the domain admins group is required.
Since Windows Server 2025 requires updates to the Active Directory schema, User1 requires membership in the schema admins, enterprise admins, and domain admins groups.
Note: A schema extension is NOT required when promoting a Windows Server 2022 server to a domain controller in a domain where domain controllers run Windows Server 2019.
References:
Upgrade domain controllers to a newer version of Windows Server
Active Directory Domain Services functional levels
Question: 333
Measured Skill: Migrate servers and workloads (20-25%)
You have a Hyper-V host named Server1 that runs Windows Server. Server1 hosts a virtual machine named VM1 that runs Windows Server and has multiple file shares.
You have an Azure subscription.
You need to migrate the file shares to Azure Storage by using Azure Storage Mover. The solution must minimize downtime and administrative effort.
What should you do on the on-premises network first?| A | On Server1, install the Azure Connected Machine agent. |
| B | On VM1, install the Azure Storage Mover agent. |
| C | On VM1, install the Azure Connected Machine agent. |
| D | On Server1, install the Azure Storage Mover agent. |
Correct answer: DExplanation:
The Azure Storage Mover service utilizes agents to perform the migration jobs you configure in the service. An agent is a virtual machine-based migration appliance that runs on a virtualization host. Ideally, your virtualization host is located as near as possible to the source storage to be migrated. Storage Mover can support multiple agents.
Because an agent is essentially a migration appliance, you interact with it through an agent-local administrative shell. The shell limits the operations you can perform on this machine, though network configuration and troubleshooting tasks are accessible.
Use of the agent in migrations is managed through Azure. Both Azure PowerShell and CLI are supported, and graphical interaction is available within the Azure portal. The agent is made available as a disk image compatible with either new Windows Hyper-V or VMware virtual machines (VMs).
Images for agent VMs are hosted on Microsoft Download Center as a zip file. Only Generation 1 VMs are supported.
Reference: Deploy an Azure Storage Mover agent